In statistics, understanding data spread and dispersion is as crucial as understanding central tendencies like the mean or median. One powerful tool used to assess the spread of a dataset is the Interquartile Range (IQR). In this article, we’ll delve into the IQR’s significance, its calculation, and its real-world applications, peppered with illustrative examples.
Definition of Interquartile Range
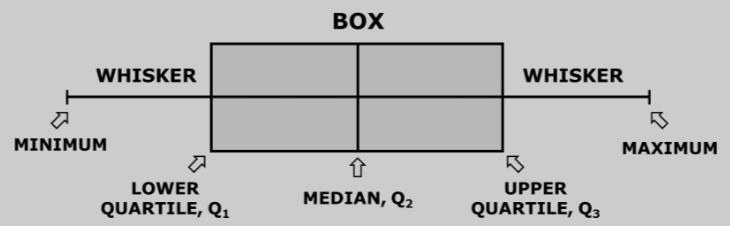
The Interquartile Range (IQR) is a measure of statistical dispersion, representing the difference between the third quartile (Q3) and the first quartile (Q1). It effectively encapsulates the middle 50% of a dataset and gives insights into its spread.
IQR = Q3 – Q1
Check Out Our Interquartile Range Calculator
Why is IQR Important?
IQR is particularly valuable because:
- It provides a measure of where the “bulk” of the values lie in a dataset.
- It is resistant to outliers, making it a robust measure of spread.
Calculating the IQR
a. Organize the Data: Before determining the IQR, data must be arranged in ascending order.
b. Find the Quartiles:
- Q1 (First Quartile): It is the median of the first half of the dataset. This means that approximately 25% of the data lie below Q1.
- Q3 (Third Quartile): It is the median of the second half of the dataset, implying about 75% of the data lie below Q3.
c. Determine the IQR: Subtract Q1 from Q3 to get the IQR.
Examples of IQR in Action
a. Exam Scores: Consider the following scores of students in a class test:
8, 12, 15, 16, 19, 22, 24, 25, 26, 28, 30, 33.
- Organizing, the scores already are in ascending order.
- Q1 is the median of the first six numbers: (15+16)/2 = 15.5.
- Q3 is the median of the last six numbers: (26+28)/2 = 27.
- IQR = 27 – 15.5 = 11.5.
This means the middle 50% of the scores have a range of 11.5 points.
b. House Prices: Consider the prices (in $1000s) of houses sold in a particular locality:
150, 180, 190, 200, 210, 230, 240, 250, 280, 300.
- Q1 (Median of first five numbers) = 190.
- Q3 (Median of the last five numbers) = 250.
- IQR = 250 – 190 = 60.
The middle 50% of house prices in that locality have a range of $60,000.
Using IQR to Detect Outliers
The IQR can also help identify outliers in a dataset. Outliers are typically considered values that lie outside 1.5 times the IQR below the first quartile or above the third quartile.
Lower Limit = Q1 – 1.5 x IQR
Upper Limit = Q3 + 1.5 x IQR
Any data points outside these limits can be considered outliers.
Example: Using the house prices from before, with an IQR of 60:
- Lower Limit = 190 – (1.5 x 60) = 100
- Upper Limit = 250 + (1.5 x 60) = 340
Since all house prices are between $100,000 and $340,000, there are no outliers in this dataset.
Advantages of IQR
- Robustness: Unlike range (which considers only the smallest and largest data values), the IQR’s concentration on quartiles makes it resistant to extreme values or outliers.
- Focus on the Middle: The IQR encapsulates the middle 50% of data, making it a more representative measure of spread for many datasets, especially when the median is used as the measure of central tendency.
Try Out Online Calculators and Tools
Real-World Applications of IQR
a. Stock Market Analysis: Financial analysts might use the IQR to understand the volatility of stock prices over a specific period.
b. Quality Control in Manufacturing: If a factory produces screws, the lengths of screws can’t vary too widely. The IQR could help assess the consistency in screw lengths.
c. Climate Studies: Meteorologists might use IQR to gauge temperature fluctuations during a particular month or season, aiding in more accurate predictions and analyses.
Summary
The Interquartile Range stands as an essential tool in the statistical toolkit. With its focus on the central 50% of a dataset and its resistance to outliers, it offers a more robust measure of spread compared to many other measures. Whether you’re examining sales data, researching climate changes, or simply trying to understand grades in a classroom, the IQR provides invaluable insights into the heart of your dataset. As with all statistical tools, understanding its strengths and nuances is the key to harnessing its full potential.