In the realm of statistics, the correlation coefficient is an indispensable tool. It offers insights into the degree to which two variables change in relation to each other. In practical scenarios, understanding the correlation coefficient can aid in predictions, research, and decision-making processes. Let’s delve deeper into the intricacies of the correlation coefficient and elucidate its significance with examples.
Definition of Correlation Coefficient
The correlation coefficient, often symbolized by ‘r’, is a statistical metric that measures the strength and direction of the linear relationship between two quantitative variables. It yields values between -1 and +1, inclusive.
- +1: Perfect positive linear relationship
- -1: Perfect negative linear relationship
- 0: No linear relationship

Check Out Our Correlation Calculator
Interpreting the Correlation Coefficient
- Positive Correlation: As one variable increases, the other also tends to increase. For example, the more hours one studies, the higher the exam scores one might achieve. Here, study hours and exam scores would likely have a positive correlation.
- Negative Correlation: An increase in one variable tends to lead to a decrease in another. Consider the relationship between the number of hours spent watching TV and grades in school. The more TV hours might correlate with lower grades.
- Zero or No Correlation: Changes in one variable don’t predict changes in the other variable. The number of hours one sleeps might have no correlation with their favorite color, for instance.
Calculating the Correlation Coefficient
The most common method to calculate the correlation coefficient is Pearson’s correlation coefficient. The formula for Pearson’s r is:
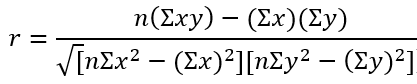
Where:
- n is the number of paired scores
- Σxy is the sum of the products of paired scores
- Σx is the sum of x scores
- Σy is the sum of y scores
Examples of Correlation Coefficient in Action
- Healthcare: In a study to determine the relationship between the consumption of sugary drinks and the incidence of diabetes, researchers might find a strong positive correlation, indicating that as sugary drink consumption increases, so does the prevalence of diabetes.
- Finance: Financial analysts often look at the correlation between different stocks or assets. If Stock A and Stock B have a negative correlation, when Stock A’s price goes up, Stock B’s price might drop, offering diversification benefits.
- Real Estate: Real estate analysts might discover a negative correlation between the distance from a city center and property prices—meaning prices often decrease the farther a property is from the city center.
Other Types of Correlation Coefficients
While Pearson’s correlation coefficient is suitable for linear relationships, not all relationships are linear. In these cases, other correlation coefficients can be more appropriate:
- Spearman’s Rank Correlation Coefficient: Used for ordinal, interval, or ratio data, it assesses monotonic relationships (either consistently increasing or decreasing but not necessarily at a constant rate).
- Kendall’s Tau: This is also used for ordinal data and measures the strength of dependence between two variables.
Limitations and Misconceptions
- Correlation does not imply causation: Just because two variables are correlated doesn’t mean one causes the other. For instance, there might be a positive correlation between ice cream sales and the number of drowning incidents. It doesn’t mean buying more ice cream causes drownings; both are influenced by an external factor, which is the temperature.
- Non-linear Relationships: The correlation coefficient mainly captures linear relationships. Two variables might be strongly related in a non-linear manner, but Pearson’s r might still be close to zero.
Practical Uses in Modern-Day Scenarios
- Machine Learning and Data Science: Correlation coefficients help in feature selection, determining which variables might be predictors for a particular outcome.
- Business Analytics: Retailers might use correlation to determine which products often get bought together, helping in effective product placements.
Try Out Online Calculators and Tools
Summary
The correlation coefficient, with its nuanced ability to capture relationships between variables, remains a staple in the statistical toolbox. Its versatility—applicable across domains like finance, healthcare, research, and more—makes it invaluable. As with all tools, its power lies in its correct application. With a clear understanding of its strengths and limitations, one can harness its full potential to derive meaningful insights from data.