
Hello, data enthusiasts! 📊
We are excited to introduce a range of powerful new statistical tools that have just been added to Visual Fractions. Whether you’re a student, educator, or data professional, these tools are designed to simplify your work and enhance your understanding of key statistical concepts. Let’s take a closer look at these exciting additions.
1. Correlation Calculator
Start exploring the relationships between different variables with our Correlation Calculator. This tool helps you easily calculate the correlation coefficient, providing a clear understanding of how two data sets are related.
Features:
- Simple data input: Enter your data manually or upload a CSV.
- Instant calculation: Get the correlation coefficient with just a click.
- Visual representation: See your data plotted on a scatter plot for better insight.
Use this tool to analyze data in fields like education, health, and economics to find meaningful correlations.
2. Interquartile Range Calculator
Understanding the spread and dispersion of your data is crucial, and our Interquartile Range (IQR) Calculator helps you do just that. The IQR is a measure of statistical dispersion and is particularly useful for identifying outliers.
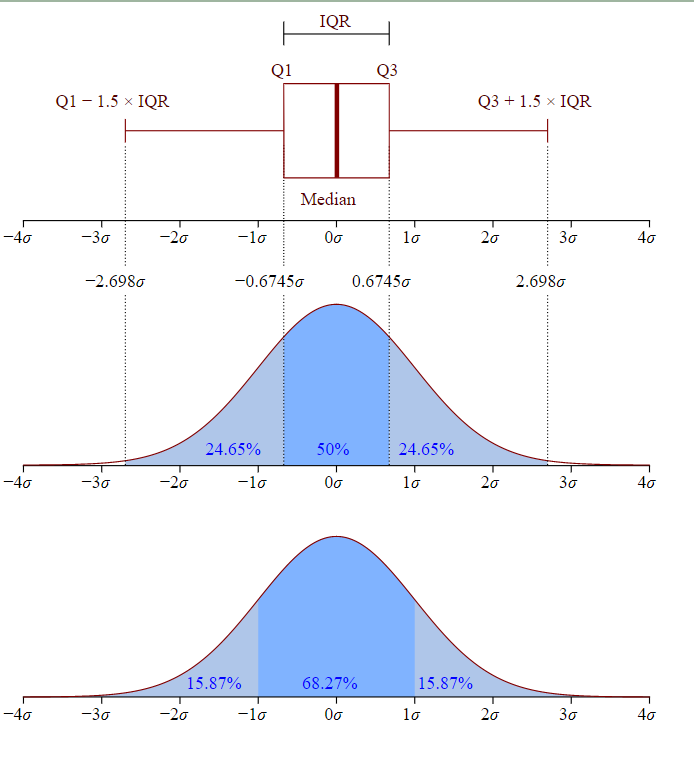
- Quick calculation: Input your data to get the IQR instantly.
- Outlier detection: Use the IQR to identify and analyze data outliers.
- Educational insights: Learn about the importance of data dispersion and how IQR is used.
This tool is perfect for anyone looking to deepen their understanding of data variability and to analyze data sets more effectively.
3. Sample Size Calculator
Planning a survey or a research project? Our Sample Size Calculator is here to help. It determines the number of observations or replicates required to achieve accurate results.
Features:
- Tailored inputs: Set your desired confidence level and margin of error.
- Instant results: Quickly find out the sample size needed for your study.
- Practical applications: Use it for academic research, market analysis, and more.
Ensure your research is statistically sound with the right sample size, making your findings more reliable and credible.
4. Binomial Probability Calculator
For those working with probabilities, our Binomial Probability Calculator is a must-have. It calculates the likelihood of a given number of successes in a set number of trials, with a specified probability of success.
Features:
- Easy input: Enter the number of trials, successes, and probability of success.
- Accurate calculations: Get the exact binomial probability and cumulative probabilities.
- Broad usage: Apply it in genetics, quality control, and decision-making scenarios.
This tool simplifies the complex calculations involved in binomial distributions, making it easier to predict outcomes and analyze data.
5. P-Value Calculator
Assess the significance of your statistical tests with our P-Value Calculator. It helps you determine whether to reject the null hypothesis by providing the p-value for your data.
Features:
- Flexible inputs: Enter your test statistic and degrees of freedom.
- Quick results: Receive your p-value instantly and understand its significance.
- Informed decisions: Make better statistical decisions based on your p-value.
Use this tool for hypothesis testing in various fields, including psychology, economics, and medicine, to make informed decisions based on your data analysis.
Why Use Visual Fractions?
At Visual Fractions, we aim to provide tools that are not only easy to use but also educational. Our new statistical tools are designed to help you:
- Enhance Learning: Understand complex statistical concepts with ease.
- Save Time: Perform accurate calculations quickly and efficiently.
- Improve Analysis: Make better decisions with reliable data insights.
Get Started Today!
Visit Visual Fractions to explore these new tools and make your statistical analysis more effective. We are committed to making data analysis accessible to everyone, whether you’re a beginner or an expert.
Stay updated with our latest tools and tips by subscribing to our newsletter and following us on social media. Together, let’s unlock the power of data!
Happy Analyzing! 📈 And don’t forget to visit our Visual Fractions YouTube Channel.